Metirc记录中用到的技术点
1. AOP
例如想记录所有数据操作的耗时,传统的方式是每个调用之前和之后记录下时间然后相减,示例:
方法调用1:
Instant timeStart = Instant.now();
DataService.listAllUserStories();
long timeDurationInMs = Instant.now().toEpochMilli() - timeStart.toEpochMilli();
方法调用2:
Instant timeStart = Instant.now();
DataService.deleteUserStory(userStoryId);
long timeDurationInMs = Instant.now().toEpochMilli() - timeStart.toEpochMilli();
使用AOP后,直接拦截DataService层的所有调用即可:
@Around("(within(com.dashboard.DataService))")
public Object aroundDataService(ProceedingJoinPoint pjp) throws Throwable {
         Instant timeStart = Instant.now();
         try {
              return pjp.proceed();
         } finally {
             long timeDurationInMs = Instant.now().toEpochMilli() - timeStart.toEpochMilli();
             ……
         }
  }
然后假设对于一些调用并不想记录(例如health check),可以自定义一个注解,然后在拦截时,指定注解即可。
@Target(ElementType.METHOD)
@Retention(RetentionPolicy.RUNTIME)
public @interface StepAnnotation {
}

@Around("(within(com.dashboard.DataService)) && annotation(stepAnnotation)")
public Object aroundDataService(ProceedingJoinPoint pjp , StepAnnotation stepAnnotation) throws Throwable
……
2 Thread Local
在记录metric时,除了最基本的一些信息(环境信息、消耗时间、发生时间、操作名等)外,很多调用都需要额外添加一些信息到metric里面,例如创建一个站点的api可能需要记录siteid,删除某个dashboard时,记录dashboard的id,诸如此类,需要绑定的信息可能不尽相同,这个时候可是使用thread local来绑定信息。
public class MetricThreadLocal {

private static final ThreadLocal FEAUTRE_METRIC_THREAD_LOCAL = new ThreadLocal();

public static FeatureMetric getFeatureMetric(){
     return FEAUTRE_METRIC_THREAD_LOCAL.get();
 }

public static void setFeatureMetric(FeatureMetric metricsRecord){
     FEAUTRE_METRIC_THREAD_LOCAL.set(metricsRecord);
 }

public static void setCurrentFeatureMetric(String attributeName, Object attributeValue){
    FeatureMetric featureMetric = getFeatureMetric();
    if(featureMetric != null) {
        featureMetric.setValue(attributeName, attributeValue);
    }
 }

public static void cleanFeatureMetirc(){
       FEAUTRE_METRIC_THREAD_LOCAL.remove();
  }

}
使用thread local时,要注意线程切换的问题:例如,假设想要在metric信息中,绑定trackingid.
(1)Thread切换
使用Thread local时,希望每个请求的日志都能绑定到对应的trackingid上,但是往往事与愿违,存在以下两种不可控情况:
(1)现象: 一些日志始终绑定某个trackingid
使用第三方或者其他人提供的包时,其他人采用的是异步线程去实现的,这个时候,第一个请求会触发第一个线程建立起来,而第一个线程的trackingid会和第一个请求一样(创建的线程的threadlocal会继承创建者):
Thread的构造器实现
        if (parent.inheritableThreadLocals != null)
            this.inheritableThreadLocals =
                ThreadLocal.createInheritedMap(parent.inheritableThreadLocals);
这样导致,只要这个线程一直存在,就一直是和第一个请求一致。
因为callable或runnable的task内容不是自己可以控制的范畴,导致再无机会去修改。
	private static final ExecutorService pool= Executors.newFixedThreadPool(3);

	public static final String checkAsync(String checkItem) {

			checkFuture= pool.submit(new Callable(checkItem) {
				public String call() throws Exception {
					......  //第三方库,无法修改,如果是自己库,直接MDC.put("TrackingID", trackingID)既可修改,或者更标准的搞法(slf4j支持):

“In such cases, it is recommended that MDC.getCopyOfContextMap() is invoked on the original (master) thread before submitting a task to the executor. When the task runs, as its first action, it should invoke MDC.setContextMapValues() to associate the stored copy of the original MDC values with the new Executor managed thread.”

				}
			});
代码示例的情况没有太大危险,因为线程一旦创建,就不会消亡,所以最多某个首次请求,查询到的日志特别多,后面的请求对不上号。但是如果某个线程池是有timeout回收的,则有可能导致很多次请求查询到的trackingid日志都特别多。
解决方案,不想固定死某个trackingid,则调用那个api前clean掉mdc里的trackingid,这样创建的线程就不会带有,即既然不属于我一个人,干脆放弃。调用完再找回。但是这样修改后,调用过程的log就都没有trackingid了。所以很难完美解决,要么有很多且对不上号的,要么一个都没有。
(2)现象:某个请求中,tracking中途丢失了或者变成别的了。
这是因为调用了第三方库,而第三库做了一些特殊处理,比如
	public String call(String checkItem) {
              call(checkItem, null)
        }
	public String call(String checkItem, Map config) {
                        String trackingID = config.get("TrackingID");
                        if(trackingID == null)
                              trackingID = "";
                        MDC.put("TrackingID", trackingID);  //因为没有显示trackingid来调用,导致后面的这段逻辑把之前设置的trackingid给清空了(="")。
                        ......
        }
解决方案: 方案(1)显式传入trackingid。而不是直接调用call(String checkItem); 方案(2)既然使用mdc,为什么不去check下mdc里面实现是不是有值,如果有,也算传入了,而不是直接覆盖掉。
以上问题很容易出现在第三方库的调用上,且如果不看代码,很难预知会出现什么清空或一直绑定某个。不管哪种情况,都要意识到所以使用mdc不是完美的,因为很多第三库的调用对于你而言都是不透明且不可修改的。
3 Filter/Task
记录metric第一件需要做的事情是选择好记录的位置,一般常见的就2种,对于web service常见就是各种filter,而对于内部实现,大多是一个thread的task创建的位置好。
   services.add(new MetricsRequestFilter());
   services.add(new MetricsResponseFilter());
@Override
public void filter(ContainerRequestContext requestContext) throws IOException {
try {
        ResourceMethodInvoker resourceMethodInvoker = (ResourceMethodInvoker)
        requestContext.getProperty("org.jboss.resteasy.core.ResourceMethodInvoker");
        if(null != resourceMethodInvoker) {
             Method method = resourceMethodInvoker.getMethod();
             writeFeatureMetricsStart(method, requestContext);
}
   }catch (Exception e){
       logger.error("filter metrics request failed.", e);
}
}
@Override
public void filter(ContainerRequestContext requestContext, ContainerResponseContext responseContext)
throws IOException {
try {
          ResourceMethodInvoker resourceMethodInvoker = (ResourceMethodInvoker) requestContext
            .getProperty("org.jboss.resteasy.core.ResourceMethodInvoker");
          if (null != resourceMethodInvoker) {
              Method method = resourceMethodInvoker.getMethod();
              writeFeatureMetricsEnd(method, requestContext, responseContext);
   }
} catch (Exception e) {
          logger.error("filter metrics response failed.", e);
}
}
public abstract class TaskWithMetric implements Runnable {

public void run() {

  TaskExecuteResult taskExecuteResult = null;
  try {
           taskExecuteResult = execute();
   } catch(Exception ex){
           taskExecuteResult = TaskExecuteResult.fromException(ex);
           throw ex;
   } finally {
           MetricThreadLocal.cleanFeatureMetirc();
     if (featureMetric != null) {
           writeMetrics(waitingDurationForThread, featureMetric, taskExecuteResult);
        }
    }
}
(1)Filter优先级
@Priority(value = 10)
public class MetricsRequestFilter implements javax.ws.rs.container.ContainerRequestFilter


4 codahales

com.datastax.driver.core.Metrics


private final Gauge knownHosts = registry.register("known-hosts", new Gauge() {
@Override
public Integer getValue() {
    return manager.metadata.allHosts().size();
}
});
5 JMX
基本现在主流的Java服务都提供jmx监控的方式, 如果只是想做展示,不想自定义更多的,这直接开启即可:
5.1 开启jmx:
-Dcom.sun.management.jmxremote=true
-Dcom.sun.management.jmxremote.port=8091 //定义port
-Dcom.sun.management.jmxremote.ssl=false
-Dcom.sun.management.jmxremote.authenticate=false
-Dcom.sun.management.jmxremote.password.file=/conf/jmxremote.password  //定义了用户名和密码
-Dcom.sun.management.jmxremote.access.file=/conf/jmxremote.access  //定义了权限
例如:
jmxremote.password
admin P@ssword123
jmxremote.access
admin readwrite
然后可以通过第三方组件来读取信息以供展示,例如collectd的GenericJMX plugin来获取信息:
<Plugin "java">
  JVMARG "-Djava.class.path=/opt/collectd/share/collectd/java/collectd-api.jar:/opt/collectd/share/collectd/java/generic-jmx.jar"
  LoadPlugin "org.collectd.java.GenericJMX"

  <Plugin "GenericJMX">
     <MBean "Memory">
      ObjectName "java.lang:type=Memory"
      InstancePrefix "Memory"
      <Value>
        Type "memory"
        Table true
        InstancePrefix "HeapMemoryUsage`"
        Attribute "HeapMemoryUsage"
      </Value>
      <Value>
        Type "memory"
        Table true
        InstancePrefix "NonHeapMemoryUsage`"
        Attribute "NonHeapMemoryUsage"
      </Value>
    </MBean>
    <MBean "GarbageCollector">
      ObjectName "java.lang:type=GarbageCollector,*"
      InstancePrefix "GarbageCollector`"
      InstanceFrom "name"
      <Value>
        Type "invocations"
        Table false
        Attribute "CollectionCount"
      </Value>
      <Value>
        Type "total_time_in_ms"
        Table false
        Attribute "CollectionTime"
      </Value>
    </MBean>
    <Connection>
      Host "localhost"
      ServiceURL "service:jmx:rmi:///jndi/rmi://localhost:8091/jmxrmi"  //8091为上文中定义的端口
      User "admin" //admin为上文中定义的用户名
      Password "P@ssword123"  //P@ssword123为上文中定义的密码
      Collect "MemoryPool"
      Collect "Memory"
      Collect "GarbageCollector"
      Collect "OperatingSystem"
      Collect "Threading"
      Collect "Runtime"
      Collect "BufferPool"
      Collect "Compilation"
      Collect "GlobalRequestProcessor"
      Collect "ThreadPool"
      Collect "DataSource"
    </Connection>
  </Plugin>
</Plugin>
5.2 自定义jmx:
定义:
public interface MetricsMBean {

	public int getTotalCount();

}


public class Metrics implements MetricsMBean {

	private int totalCountConnections;

	public Metrics(int totalCountConnections) {
 		this.totalCountConnections = totalCountConnections;
	}

	@Override
	public int getTotalCount() {
 		return totalCountConnections;
	}

}
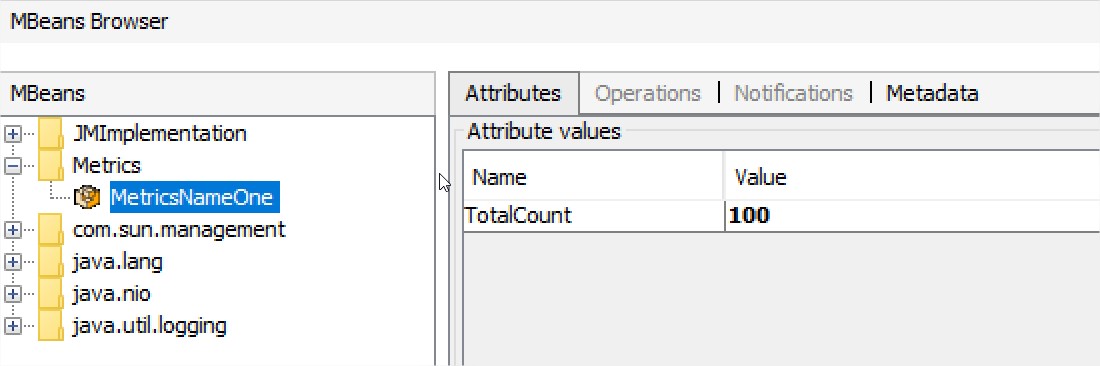
启动:
	MBeanServer server = ManagementFactory.getPlatformMBeanServer();
	ObjectName metricsName = new ObjectName("Metrics:name=MetricsNameOne");
	server.registerMBean(new Metrics(100), metricsName);
另外我们可以使用jmx的通知来实现一些有趣的功能。例如当gc时,输出一条metric:
定义通知行为:
private final static class NotificationListenerImplementation implements NotificationListener {

		private long jvmStartTime;
		private MetricsHandler metricHandler;

 		public NotificationListenerImplementation(long jvmStartTime, MetricsHandler metricHandler) {
			super();
			this.jvmStartTime = jvmStartTime;
			this.metricHandler = metricHandler;
		}

		@Override
		public void handleNotification(Notification notification, Object handback) {
			if (LOGGER.isDebugEnabled()) {
				LOGGER.debug("received notifcation: " + notification.getType());
			}

			//write one GC metrics
 		}


	}
注册通知:
long jvmStartTime = ManagementFactory.getRuntimeMXBean().getStartTime();
			List<GarbageCollectorMXBean> gcbeans = ManagementFactory.getGarbageCollectorMXBeans();
			for (GarbageCollectorMXBean gcbean : gcbeans) {
 				LOGGER.info("GC bean: " + gcbean);
				if (!(gcbean instanceof NotificationEmitter))
					continue;

				NotificationEmitter emitter = (NotificationEmitter) gcbean;
				emitter.addNotificationListener(new NotificationListenerImplementation(jvmStartTime, metricHandler), notification -> {
 						return GarbageCollectionNotificationInfo.GARBAGE_COLLECTION_NOTIFICATION
						.equals(notification.getType());
 				}, null);

			}
这样就可以得到类似如下的metrics:
{
  "featureName": "java_gc",
  "componentType": "DSA",
  "componentAddress": "10.224.56.146",
  "componentVer": "1.5.0 ",
  "poolName": "production",
  "metricType": "innerApi",
  "timestamp": "2017-05-25T04:45:33.235Z",
  "values": {
    "steps": [

    ],
    "totalDurationInMS": 254
  },
  "trackingID": "3"
}
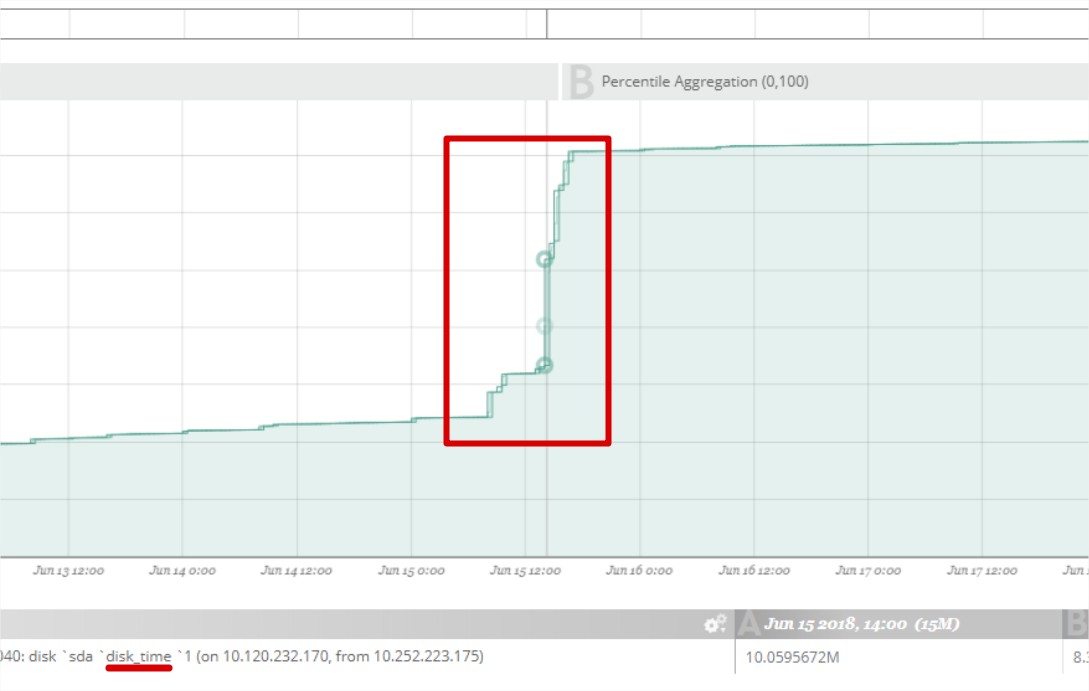
6 threshold
在输出metric时,有时需要平衡数据量和实际用途。对于一些数据量会很大,但是大多实际并无有用,但是需要时,又可能抓狂没有到数据,大多我们可以使用threadhold来均衡数据和实际用途,例如对于dns解析,大多时候,dns解析都很快,我们不需要metric来记录这些信息,但是有的时候,排除排查延时较大时,需要知道dns是否是个影响因素,这个时候,可以采用 threadhold来控制,例如超过500ms的dns解析才需要记录:
public class MetricsDnsResolver implements DnsResolver {

	private static final int THRESHOLD_IN_MS = 100;
	private static final Logger LOGGER = Logger.getLogger(MetricsDnsResolver .class);

     public InetAddress[] resolve(String host) throws UnknownHostException {
    	long startTime = System.currentTimeMillis();
    	InetAddress[] allByName = null;
    	try {
            allByName = InetAddress.getAllByName(host);
    	}finally {
            long duration = System.currentTimeMillis() - startTime;
            if(duration > THRESHOLD_IN_MS) {
                LOGGER.warn("DNS: " + host + ", take too long time(ms): " + duration);
                //write metric here
            }
    	}
这样既避免了大多无用的数据量,同时,在真正需要时,又能有据可查。
Threshold的思想在metric设计时,非常重要,能保持数据的有效有力。
总结: 以上几种技术要点很多时候,都是混合在一起使用的,例如将jmx和codahales结合在一起,更方便的统计metric, 以Cassandra的jmx metric作为例子:
org.apache.cassandra.metrics.CassandraMetricsRegistry
    public interface JmxHistogramMBean extends MetricMBean
    {
        long getCount();

        long getMin();

        long getMax();

        double getMean();

        double getStdDev();

        double get50thPercentile();

        double get75thPercentile();

        double get95thPercentile();

        double get98thPercentile();

        double get99thPercentile();

        double get999thPercentile();

        long[] values();
    }
    private static class JmxHistogram extends AbstractBean implements JmxHistogramMBean
    {
        private final Histogram metric;

        private JmxHistogram(Histogram metric, ObjectName objectName)
        {
            super(objectName);
            this.metric = metric;
        }

        @Override
        public double get50thPercentile()
        {
            return metric.getSnapshot().getMedian();
        }

        @Override
        public long getCount()
        {
            return metric.getCount();
        }

        @Override
        public long getMin()
        {
            return metric.getSnapshot().getMin();
        }

        @Override
        public long getMax()
        {
            return metric.getSnapshot().getMax();
        }

        @Override
        public double getMean()
        {
            return metric.getSnapshot().getMean();
        }

        @Override
        public double getStdDev()
        {
            return metric.getSnapshot().getStdDev();
        }

        @Override
        public double get75thPercentile()
        {
            return metric.getSnapshot().get75thPercentile();
        }

        @Override
        public double get95thPercentile()
        {
            return metric.getSnapshot().get95thPercentile();
        }

        @Override
        public double get98thPercentile()
        {
            return metric.getSnapshot().get98thPercentile();
        }

        @Override
        public double get99thPercentile()
        {
            return metric.getSnapshot().get99thPercentile();
        }

        @Override
        public double get999thPercentile()
        {
            return metric.getSnapshot().get999thPercentile();
        }

        @Override
        public long[] values()
        {
            return metric.getSnapshot().getValues();
        }
    }
    private abstract static class AbstractBean implements MetricMBean
    {
        private final ObjectName objectName;

        AbstractBean(ObjectName objectName)
        {
            this.objectName = objectName;
        }

        @Override
        public ObjectName objectName()
        {
            return objectName;
        }
    }
再如,现在新兴的spring metric,也是将以上的一些技术进行了一些组合,提供了良好的封装,例如下面的使用方式非常简易。
@SpringBootApplication
@EnablePrometheusMetrics
public class MyApp {
}

@RestController
@Timed
class PersonController {
    Map<Integer, Person> people = new Map<Integer, Person>();

    public PersonController(MeterRegistry registry) {
        // constructs a gauge to monitor the size of the population
        registry.mapSize("population", people);
    }

    @GetMapping("/api/people")
    public List<Person> listPeople() {
        return people;
    }

    @GetMapping("/api/person/")
    public Person findPerson(@PathVariable Integer id) {
        return people.get(id);
    }
}
参考文献:
1. https://docs.spring.io/spring-metrics/docs/current/public/prometheus