TIG:
telegraf
1 install
1.1 create /etc/yum.repos.d/influxdb.repo:
[influxdb]
name = InfluxDB Repository – RHEL \$releasever
baseurl = https://repos.influxdata.com/rhel/\$releasever/\$basearch/stable
enabled = 1
gpgcheck = 1
gpgkey = https://repos.influxdata.com/influxdb.key
1.2 sudo yum install telegraf
1.3 startup
sudo service telegraf start
Or if your operating system is using systemd (CentOS 7+, RHEL 7+):
sudo systemctl start telegraf
2 Config:
默认配置文件为/etc/telegraf/telegraf.conf,也可以查看https://github.com/influxdata/telegraf/blob/master/etc/telegraf.conf, telegraf是通过输入、转化,输出插件方式来管理的。
所以默认什么都不做修改时的,telegraf收集的是如下信息:
inputs.disk inputs.diskio inputs.kernel inputs.mem inputs.processes inputs.swap inputs.system inputs.cpu
而输出采用的是influxdb方式。这点可以通过启动日志来观察到:
2018/09/17 01:31:19 I! Using config file: /etc/telegraf/telegraf.conf
2018-09-17T01:31:19Z W! [outputs.influxdb] when writing to [http://localhost:8086]: database “telegraf” creation failed: Post http://localhost:8086/query: dial tcp 127.0.0.1:8086: connect: connection refused
2018-09-17T01:31:19Z I! Starting Telegraf v1.7.4
2018-09-17T01:31:19Z I! Loaded inputs: inputs.disk inputs.diskio inputs.kernel inputs.mem inputs.processes inputs.swap inputs.system inputs.cpu
2018-09-17T01:31:19Z I! Loaded aggregators:
2018-09-17T01:31:19Z I! Loaded processors:
2018-09-17T01:31:19Z I! Loaded outputs: influxdb
2018-09-17T01:31:19Z I! Tags enabled: host=appOne
2018-09-17T01:31:19Z I! Agent Config: Interval:10s, Quiet:false, Hostname:”telegraf”, Flush Interval:10s
2018-09-17T01:31:30Z E! [outputs.influxdb]: when writing to [http://localhost:8086]: Post http://localhost:8086/write?db=telegraf: dial tcp 127.0.0.1:8086
所以如果需要修改或者定制可以直接修改/etc/telegraf/telegraf.conf达到目标,但是默认配置里面有太多冗余插件信息去注释掉,所以telegraf提供了一种简洁的方式来产生配置文件。
#telegraf –input-filter redis:cpu:mem:net:swap –output-filter influxdb:kafka config //采集多个指标
#telegraf –input-filter redis –output-filter influxdb config //采集一个指标
例如,产生一个redis.conf的配置:
#telegraf -sample-config -input-filter redis:mem -output-filter influxdb > redis.conf
产生后的配置内容如下:
###############################################################################
# INPUT PLUGINS #
###############################################################################
# Read metrics about memory usage
[[inputs.mem]]
# no configuration
[[inputs.redis]]
## specify servers via a url matching:
## [protocol://][:password]@address[:port]
## e.g.
## tcp://localhost:6379
## tcp://:password@192.168.99.100
## unix:///var/run/redis.sock
##
## If no servers are specified, then localhost is used as the host.
## If no port is specified, 6379 is used
servers = [“tcp://localhost:6379”]
###############################################################################
# OUTPUT PLUGINS #
###############################################################################
# Configuration for sending metrics to InfluxDB
[[outputs.influxdb]]
## The full HTTP or UDP URL for your InfluxDB instance.
##
## Multiple URLs can be specified for a single cluster, only ONE of the
## urls will be written to each interval.
# urls = [“unix:///var/run/influxdb.sock”]
# urls = [“udp://127.0.0.1:8089”]
# urls = [“http://127.0.0.1:8086”]
## The target database for metrics; will be created as needed.
# database = “telegraf”
# username = “telegraf”
# password = “metricsmetricsmetricsmetrics”
然后以这个文件作为启动配置文件启动:
#telegraf –config /etc/telegraf/redis.conf
[root@telegraf ~]# telegraf –config /etc/telegraf/redis.conf
2018-09-17T02:43:08Z I! Starting Telegraf v1.7.4
2018-09-17T02:43:08Z I! Loaded inputs: inputs.redis inputs.mem
2018-09-17T02:43:08Z I! Loaded aggregators:
2018-09-17T02:43:08Z I! Loaded processors:
2018-09-17T02:43:08Z I! Loaded outputs: influxdb
2018-09-17T02:43:08Z I! Tags enabled: host=telegraf
2018-09-17T02:43:08Z I! Agent Config: Interval:10s, Quiet:false, Hostname:”telegraf “, Flush Interval:10s
此时,influxdb会受到请求:
2018-09-17T02:43:08.060799Z info Executing query {“log_id”: “0AaMBDO0000”, “service”: “query”, “query”: “CREATE DATABASE telegraf”}
[httpd] 127.0.0.1 – – [17/Sep/2018:02:43:08 +0000] “POST /query HTTP/1.1” 200 57 “-” “telegraf” 68dafe05-ba23-11e8-8001-000000000000 108642
[httpd] 127.0.0.1 – – [17/Sep/2018:02:43:20 +0000] “POST /write?db=telegraf HTTP/1.1” 204 0 “-” “telegraf” 7026fecd-ba23-11e8-8002-000000000000 595855
[httpd] 127.0.0.1 – – [17/Sep/2018:02:43:30 +0000] “POST /write?db=telegraf HTTP/1.1” 204 0 “-” “telegraf” 761ceb12-ba23-11e8-8003-000000000000 149522
[httpd] 127.0.0.1 – – [17/Sep/2018:02:43:40 +0000] “POST /write?db=telegraf HTTP/1.1” 204 0 “-” “telegraf” 7c12cd50-ba23-11e8-8004-000000000000 326783
[httpd] 127.0.0.1 – – [17/Sep/2018:02:43:50 +0000] “POST /write?db=telegraf HTTP/1.1” 204 0 “-” “telegraf” 820892ba-ba23-11e8-8005-000000000000 101009
[httpd] 127.0.0.1 – – [17/Sep/2018:02:44:00 +0000] “POST /write?db=telegraf HTTP/1.1” 204 0 “-” “telegraf” 87fe77d9-ba23-11e8-8006-000000000000 86017
[httpd] 127.0.0.1 – – [17/Sep/2018:02:44:10 +0000] “POST /write?db=telegraf HTTP/1.1” 204 0 “-” “telegraf” 8df464b0-ba23-11e8-8007-000000000000 85689
通过influxdb的client命令就可以查询到收集到的信息了,非常简单方便:
[root@influx ~]# influx
Connected to http://localhost:8086 version 1.6.2
InfluxDB shell version: 1.6.2
> show databases
name: databases
name
—-
_internal
telegraf
> use telegraf
Using database telegraf
>
> show measurements
name: measurements
name
—-
mem
redis
> select * from redis limit 1;
name: redis
time aof_current_rewrite_time_sec aof_enabled aof_last_bgrewrite_status aof_last_rewrite_time_sec aof_last_write_status aof_rewrite_in_progress aof_rewrite_scheduled blocked_clients client_biggest_input_buf client_longest_output_list clients cluster_enabled connected_slaves evicted_keys expired_keys host instantaneous_input_kbps instantaneous_ops_per_sec instantaneous_output_kbps keyspace_hitrate keyspace_hits keyspace_misses latest_fork_usec loading lru_clock master_repl_offset maxmemory maxmemory_policy mem_fragmentation_ratio migrate_cached_sockets port pubsub_channels pubsub_patterns rdb_bgsave_in_progress rdb_changes_since_last_save rdb_current_bgsave_time_sec rdb_last_bgsave_status rdb_last_bgsave_time_sec rdb_last_save_time rdb_last_save_time_elapsed redis_version rejected_connections repl_backlog_active repl_backlog_first_byte_offset repl_backlog_histlen repl_backlog_size replication_role server slave0 sync_full sync_partial_err sync_partial_ok total_commands_processed total_connections_received total_net_input_bytes total_net_output_bytes total_system_memory uptime used_cpu_sys used_cpu_sys_children used_cpu_user used_cpu_user_children used_memory used_memory_lua used_memory_peak used_memory_rss
—- —————————- ———– ————————- ————————- ——————— ———————– ——————— ————— ———————— ————————– ——- ————— —————- ———— ———— —- ———————— ————————- ————————- —————- ————- ————— —————- ——- ——— —————— ——— —————- ———————– ———————- —- ————— ————— ———————- ————————— ————————— ———————- ———————— —————— ————————– ————- ——————– ——————- —————————— ——————– —————– —————- —— —— ——— —————- ————— ———————— ————————– ——————— ———————- ——————- —— ———— ——————— ————- ———————- ———– ————— —————- —————
1537152190000000000 -1 0 ok -1 ok 0 0 0 0 0 41 1 1 0 778 telegraf 0.09 2 0.01 1 188 0 379 0 10425533 16473380 8000000000 allkeys-lru 1.17 0 7001 0 0 0 856 -1 ok 1 1530088772 7063418 3.2.8 0 1 15424805 1048576 1048576 master 10.224.91.231 ip=10.224.91.234,port=7001,state=online,offset=16473380,lag=1 2 0 0 19620365 1239692 500589135 885305642 33670017024 11549541 15528.8 0 8857.04 0 4476504 37888 5601248 5259264
>
select * from mem limit 1;
name: mem
time active available available_percent buffered cached free host inactive slab total used used_percent wired
—- —— ——— —————– ——– —— —- —- ——– —- —– —- ———— —–
1537152190000000000 771219456 7859949568 93.83099562612006 422666240 890130432 6547152896 telegraf 860303360 142872576 8376709120 516759552 6.169004373879942 0
>
>
grafana
1 install
注意安装要求64位机器:
a. 创建grafana安装源 /etc/yum.repos.d/grafana.repo
[grafana]
name=grafana
baseurl=https://packagecloud.io/grafana/stable/el/7/$basearch
repo_gpgcheck=1
enabled=1
gpgcheck=1
gpgkey=https://packagecloud.io/gpg.key https://grafanarel.s3.amazonaws.com/RPM-GPG-KEY-grafana
sslverify=1
sslcacert=/etc/pki/tls/certs/ca-bundle.crt
2. 安装和启动
$ sudo yum install grafana$ sudo service grafana-server start
启动后,默认HTTP port 是3000, 默认用户和用户组是admin.
加入启动时运行列表:
$ sudo /sbin/chkconfig --add grafana-server3. 使用
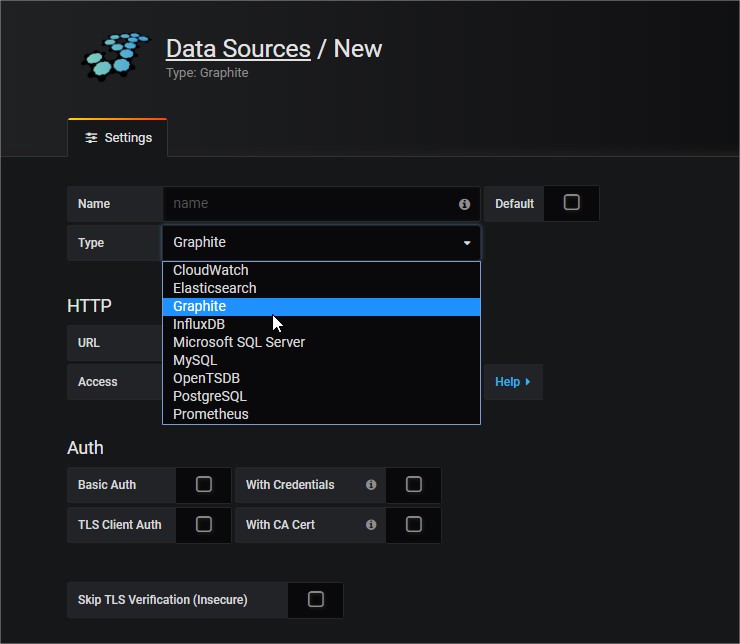
a 创建数据源: 数据源支持很多种,例如常见的influxdb,elastic search和mysql等等。
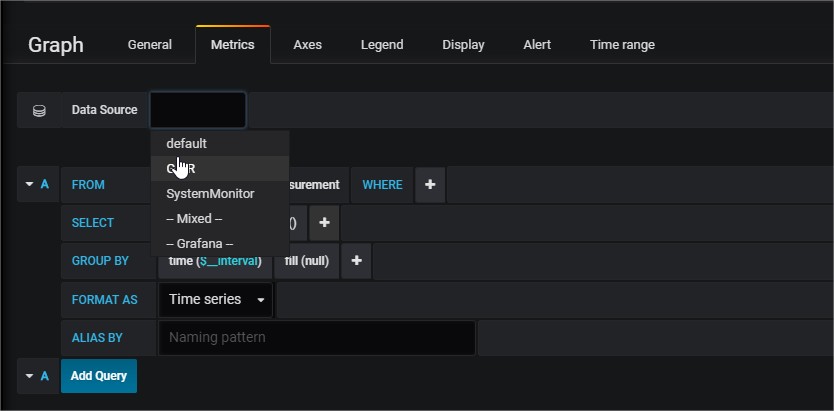
b 创建dashboard, 要点就是选择步骤1创建的数据源,然后绘制各种图形。
上面2步即可完成基本操作,然后可以基于绘制的数据创建alert,不做赘述。