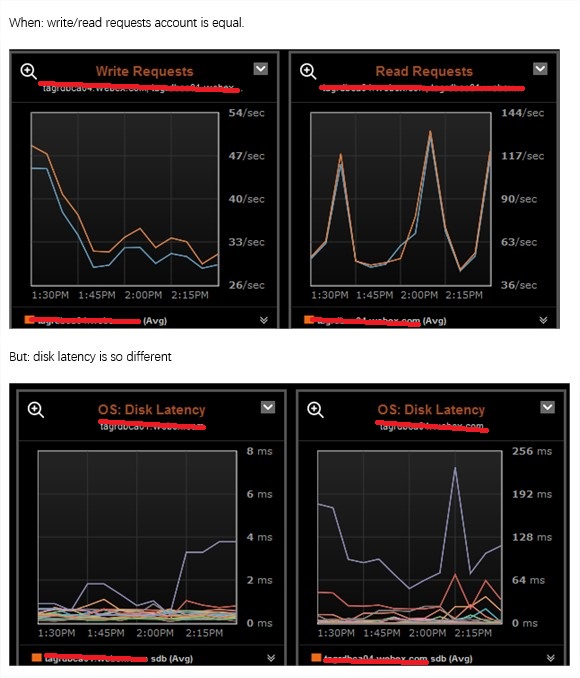
最近半年,应用程序使用Cassandra的timeout问题更加明显了:类型增多、次数增多,虽然平均三、四周才发生一次,但是已经到了必须解决问题(满足下好奇心)的时间了,对于数据库的使用而言,一般都是当“黑盒子”来使用,而且因为归属于基础设施层面,在设计的时候,也都严格控制了日志的输出,这都给查找问题带来了很大难度,所以以下综合发生问题的类型,来回顾记录追查的过程和手段。(以下所有讨论基于最常见的结构:replication factor: 3. read/write consistency level: local_quarm)
从报错的类型看:
(1)Cassandra返回的错误:写超时
Cassandra timeout during write query at consistency LOCAL_QUORUM (2 replica were required but only 1 acknowledged the write)
(2)Cassandra返回的错误:读超时
Cassandra timeout during read query at consistency LOCAL_QUORUM (2 responses were required but only 1 replica responded)
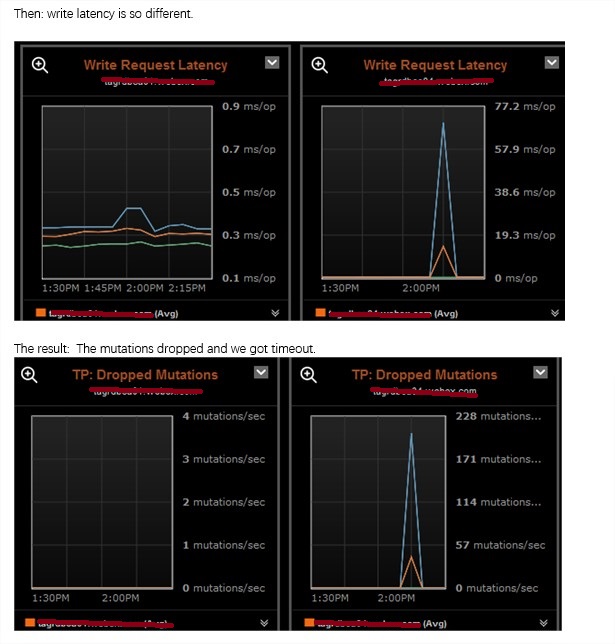
(3)客户端返回的错误:超时,没有接收到cassandra的操作结果。
java.util.concurrent.TimeoutException: Timeout waiting for task.
首先分析问题(1):出现timeout的原因,需要至少写两份数据的节点(一共写三份)返回,但是实际上等了timeout(默认2000ms)时间后,只等到了其中一个节点。那么为什么没有等到呢?任何一件事的处理都包括两个阶段:等待和执行。那排除执行本身时间太久:例如本身CQL写操作的数据内容或操作就很大,则很大原因可能在于处理的任务等的太久,以致于抛弃。其实这2个因素之间也是互相影响的,例如,单个执行慢,那别人等待的时间会增大。而单个执行对于cassandra而言主要就是写内存+写commit log,这个问题的定位可查看关键词,看当时是否有任务丢了。
    public void get() throws WriteTimeoutException, WriteFailureException
    {
        long timeout = currentTimeout();

        boolean success;
        try
        {
            success = condition.await(timeout, TimeUnit.NANOSECONDS);
        }
        catch (InterruptedException ex)
        {
            throw new AssertionError(ex);
        }

        if (!success)
        {
            int blockedFor = totalBlockFor();
            int acks = ackCount();
            // It's pretty unlikely, but we can race between exiting await above and here, so
            // that we could now have enough acks. In that case, we "lie" on the acks count to
            // avoid sending confusing info to the user (see CASSANDRA-6491).
            if (acks <= blockedFor)
                acks = blockedFor - 1;
            throw new WriteTimeoutException(writeType, consistencyLevel, acks, blockedFor);
        }

        if (totalBlockFor() + failures < totalEndpoints())
        {
            throw new WriteFailureException(consistencyLevel, ackCount(), totalBlockFor(), writeType, failureReasonByEndpoint);
        }
    }

    public final long currentTimeout()
    {
        long requestTimeout = writeType == WriteType.COUNTER
                              ? DatabaseDescriptor.getCounterWriteRpcTimeout()
                              : DatabaseDescriptor.getWriteRpcTimeout();
        return TimeUnit.MILLISECONDS.toNanos(requestTimeout) - (System.nanoTime() - queryStartNanoTime);
    }
[root@cassandra001 logs]# zgrep -i 'messages were dropped'  system.log* |grep -i MUTATION

system.log.11.zip:INFO [ScheduledTasks:1] 2019-01-24 06:02:52,243  MessagingService.java:929 - MUTATION messages were dropped in last 5000 ms: 9641 for internal timeout and 0 for cross node timeout
源码分析:
   org.apache.cassandra.net.MessageDeliveryTask:
   public void run()
    {
        MessagingService.Verb verb = message.verb;

        long timeTaken = message.getLifetimeInMS();  //ApproximateTime.currentTimeMillis() - constructionTime,即等待时间:开始处理时间减去构建时间
        if (MessagingService.DROPPABLE_VERBS.contains(verb) && timeTaken > getTimeout()) //不同类型的操作,超时时间不同,参考MessagingService.Verb
        {
            MessagingService.instance().incrementDroppedMessages(message, timeTaken);
            return;
        }
各种类型操作的超时时间:org.apache.cassandra.net.MessagingService.Verb
   public enum Verb
    {
        MUTATION
        {
            public long getTimeout()
            {
                return DatabaseDescriptor.getWriteRpcTimeout(); //  public volatile long write_request_timeout_in_ms = 2000L;
            }
        },
         READ_REPAIR
        {
            public long getTimeout()
            {
                return DatabaseDescriptor.getWriteRpcTimeout(); //  public volatile long write_request_timeout_in_ms = 2000L;
            }
        },
        READ
        {
            public long getTimeout()
            {
                return DatabaseDescriptor.getReadRpcTimeout(); //  public volatile long read_request_timeout_in_ms = 5000L;

            }
        },
手段:
1 查GC影响
首先看到这个问题,第一想到的是GC的影响,除了jmx本身的展示外,还有两种手段:
(1)nodetool gcstats: 查看“Max GC Elapsed (ms)”就知道到底最大影响多久。
[root@cassandra001 ~]# nodetool gcstats
Interval (ms) Max GC Elapsed (ms)Total GC Elapsed (ms)Stdev GC Elapsed (ms) GC Reclaimed (MB) Collections
9497938881                   632                11415528 28 545351003897880 125586
(2) gc日志:会提醒说查时间点是否发生gc,以及gc花了多久。
INFO;[Service Thread] 2019-01-16 06:03:31,977 ;GCInspector.java:258 - G1 Young Generation GC in 230ms.&nbsp; G1 Eden Space: 9705619456 --> 0; G1 Old Gen: 3363831808 -> 3489807376; G1 Survivor Space: 595591168 -> 1291845632;
2 查表的性能数据:
执行:
 nodetool cfhistograms <keyspace> <table>
 例如:nodetool cfhistograms keyspace_xxx table_yyy
结果:
keyspace_xxx/table_yyy histograms
Percentile  SSTables     Write Latency      Read Latency    Partition Size        Cell Count
                              (micros)          (micros)           (bytes)
50%             0.00            372.00              0.00               642                12
75%             0.00           2759.00              0.00              2759                50
95%             0.00          20501.00              0.00             35425               642
98%             0.00          42510.00              0.00            105778              2299
99%             0.00          73457.00              0.00            263210              5722
Min             0.00              6.00              0.00               536                11
Max             0.00         545791.00              0.00          30130992            654949
3 查磁盘性能
refer to http://www.strolling.cn/2019/03/performance-turning-disk/
sdc               0.00    40.23    0.99    2.12   144.29   338.80   155.52     0.02    7.68    0.36   11.09   0.21   0.06
sdc1              0.00    40.23    0.99    2.12   144.29   338.80   155.52     0.02    7.68    0.36   11.09   0.21   0.06
sdb               0.00     0.00    0.00    0.00     0.00     0.00    24.89     0.00    0.14    0.14    0.00   0.14   0.00
sde               0.00    80.05    0.20    2.97    16.89   664.23   214.30     0.02    7.20    0.39    7.66   0.34   0.11
sde1              0.00    19.64    0.20    1.03    16.88   165.34   147.84     0.01    9.42    0.38   11.21   0.22   0.03
sde2              0.00    60.42    0.00    1.95     0.00   498.89   256.40     0.01    5.79    3.80    5.79   0.42   0.08
sdd               0.00    38.47    1.80    2.01   237.10   323.88   147.09     0.02    5.95    0.35   10.95   0.20   0.07
sdd1              0.00    38.47    1.80    2.01   237.10   323.88   147.09     0.02    5.95    0.35   10.95   0.20   0.07
4 查日志:
除了丢数据本身那条日志(文上)外,当丢数据(MessagingService.logDroppedMessages)或者gc(GCInspector.handleNotification(Notification, Object))时,cassandra会打印出工作状态:包括各种queue的size情况:
INFO  [ScheduledTasks:1] 2019-02-07 06:03:30,276  StatusLogger.java:51 - Pool Name                    Active   Pending      Completed   Blocked  All Time Blocked
INFO  [ScheduledTasks:1] 2019-02-07 06:03:30,276  StatusLogger.java:66 - MutationStage                    32      6686     1613266420         0                 0
INFO  [ScheduledTasks:1] 2019-02-07 06:03:30,276  StatusLogger.java:66 - ReadStage                         0         0     1261991952         0                 0
INFO  [ScheduledTasks:1] 2019-02-07 06:03:30,276  StatusLogger.java:66 - RequestResponseStage              0         0     2755306099         0                 0
INFO  [ScheduledTasks:1] 2019-02-07 06:03:30,276  StatusLogger.java:66 - ReadRepairStage                   0         0        3046997         0                 0
INFO  [ScheduledTasks:1] 2019-02-07 06:03:30,276  StatusLogger.java:66 - CounterMutationStage              0         0              0         0                 0
INFO  [ScheduledTasks:1] 2019-02-07 06:03:30,276  StatusLogger.java:66 - MiscStage                         0         0              0         0                 0
INFO  [ScheduledTasks:1] 2019-02-07 06:03:30,277  StatusLogger.java:66 - HintedHandoff                     0         0           1268         0                 0
INFO  [ScheduledTasks:1] 2019-02-07 06:03:30,277  StatusLogger.java:66 - GossipStage                       0         0       22851491         0                 0
INFO  [ScheduledTasks:1] 2019-02-07 06:03:30,277  StatusLogger.java:66 - CacheCleanupExecutor              0         0              0         0                 0
INFO  [ScheduledTasks:1] 2019-02-07 06:03:30,277  StatusLogger.java:66 - InternalResponseStage             0         0              0         0                 0
INFO  [ScheduledTasks:1] 2019-02-07 06:03:30,277  StatusLogger.java:66 - CommitLogArchiver                 0         0          65246         0                 0
INFO  [ScheduledTasks:1] 2019-02-07 06:03:30,277  StatusLogger.java:66 - ValidationExecutor                0         0         286603         0                 0
INFO  [ScheduledTasks:1] 2019-02-07 06:03:30,277  StatusLogger.java:66 - MigrationStage                    0         0             70         0                 0
INFO  [ScheduledTasks:1] 2019-02-07 06:03:30,277  StatusLogger.java:66 - CompactionExecutor                1         1       57541810         0                 0
INFO  [ScheduledTasks:1] 2019-02-07 06:03:30,278  StatusLogger.java:66 - AntiEntropyStage                  1         1         873618         0                 0
INFO  [ScheduledTasks:1] 2019-02-07 06:03:30,278  StatusLogger.java:66 - PendingRangeCalculator            0         0             83         0                 0
INFO  [ScheduledTasks:1] 2019-02-07 06:03:30,278  StatusLogger.java:66 - Sampler                           0         0              0         0                 0
INFO  [ScheduledTasks:1] 2019-02-07 06:03:30,278  StatusLogger.java:66 - MemtableFlushWriter               2         2         381132         0                 0
INFO  [ScheduledTasks:1] 2019-02-07 06:03:30,278  StatusLogger.java:66 - MemtablePostFlush                 1         3         774796         0                 0
INFO  [ScheduledTasks:1] 2019-02-07 06:03:30,278  StatusLogger.java:66 - MemtableReclaimMemory             0         0         486188         0                 0
INFO  [ScheduledTasks:1] 2019-02-07 06:03:30,279  StatusLogger.java:75 - CompactionManager                 1         1
INFO  [ScheduledTasks:1] 2019-02-07 06:03:30,279  StatusLogger.java:87 - MessagingService                n/a       3/0
INFO  [ScheduledTasks:1] 2019-02-07 06:03:30,279  StatusLogger.java:97 - Cache Type                     Size                 Capacity               KeysToSave
INFO  [ScheduledTasks:1] 2019-02-07 06:03:30,279  StatusLogger.java:99 - KeyCache                  104857407                104857600                      all
INFO  [ScheduledTasks:1] 2019-02-07 06:03:30,279  StatusLogger.java:105 - RowCache                          0                        0                      all
另外可以使用
nodetool <options> tpstats
来看各job/queue等情况,类似上面的结果。
5 看网络:
看流量:安装iftop
wget http://download-ib01.fedoraproject.org/pub/epel/6/x86_64/Packages/i/iftop-1.0-0.14.pre4.el6.x86_64.rpm
看网络接口详细信息:
 cat /proc/net/bonding/bond0
Ethernet Channel Bonding Driver: v3.7.1 (April 27, 2011)

Bonding Mode: fault-tolerance (active-backup)
Primary Slave: None
Currently Active Slave: eth0
MII Status: up
MII Polling Interval (ms): 100
Up Delay (ms): 0
Down Delay (ms): 0

Slave Interface: eth0
MII Status: up
Speed: 10000 Mbps
Duplex: full
Link Failure Count: 0
Permanent HW addr: 38:90:a5:14:9b:74
Slave queue ID: 0

Slave Interface: eth1
MII Status: up
Speed: 10000 Mbps
Duplex: full
Link Failure Count: 0
Permanent HW addr: 38:90:a5:14:9b:75
Slave queue ID: 0
6 多对比
特别是当仅仅部分机器出问题的时候,可以使用ops center来对比,没有的话,只能一个一个用命令等方式做对比。
一些困惑解析:
1 read请求明明是5s timeout,为什么有的时候2s timeout?
因为read有的时,会触发read repair,特别是本来cassandra写入就经常出问题的时候,而因为bug的存在:https://issues.apache.org/jira/browse/CASSANDRA-10726%3E
导致repair的时候,会阻塞等待,而阻塞等待的时间是写超时的时间(READ_REPAIR)。
2 Timeout waiting for task.
这种错误,很少发生,发生的问题问题根源定位在网络。
3 cassandra的核心操作?也就是最容易出现性能瓶颈问题的根源。
写内存+写Commit log(可关闭)
总结:
查询问题,零散烦复,主要就是找规律,多对比,全面查,限于篇幅,不详述了。